Reservoir_Simulation_in_MATLAB

项目描述:

  • 创建动态模型练习Formulate a dynamic model with model quantities such as constants, parameters, and variables and model expressions such as intermediates and equations.
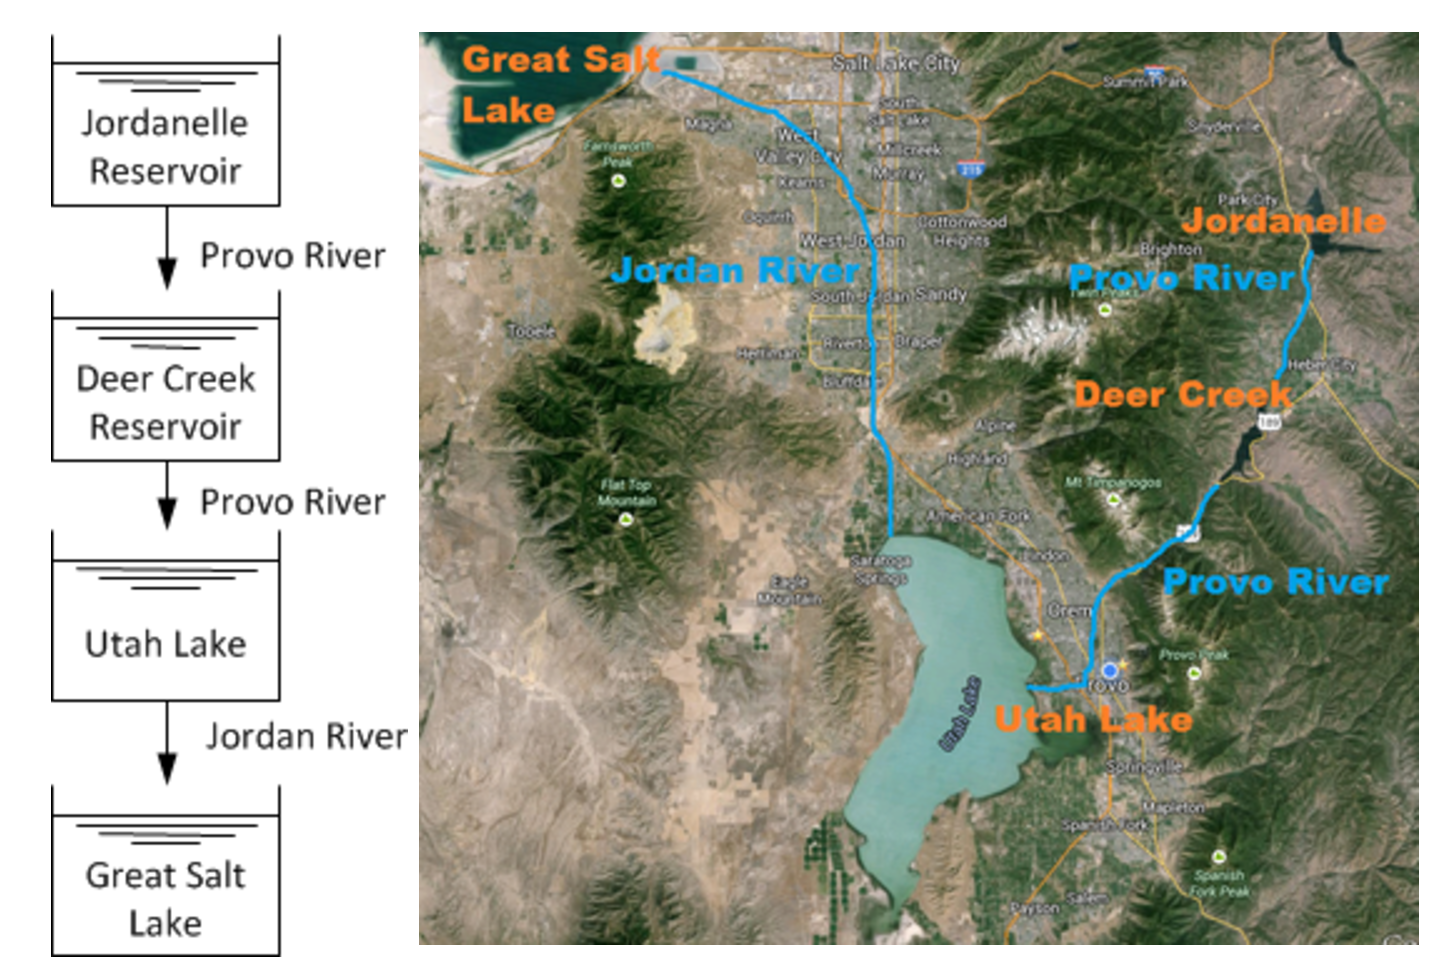
  • 具体实例是一个区域的水资源利用情况In Utah, water flows into the (1) Jordanelle reservoir, to the (2) Deer Creek reservoir, to (3) Utah Lake, and finally to the (4) Great Salt Lake.
  • 两个假定:

    • (1)河道流量与水库高程的平方根成比例;Suppose that there is a spillway from each upstream body of water to the lower body of water with a flow that is proportional to the square root of the reservoir height.
    • (2)下游的Great Salt Lake没有出流;There is no outflow from the Great Salt Lake except due to evaporation.
    • (3)没有人为的调控及不考虑其他相关河流补给。This is a simple simulation model that assumes no active control.Utah Lake and the Great Salt Lake also have additional inlet sources such as the Payson River (Utah Lake) and the Weber River and Bear River (Great Salt Lake) that are not considered in this simulation.
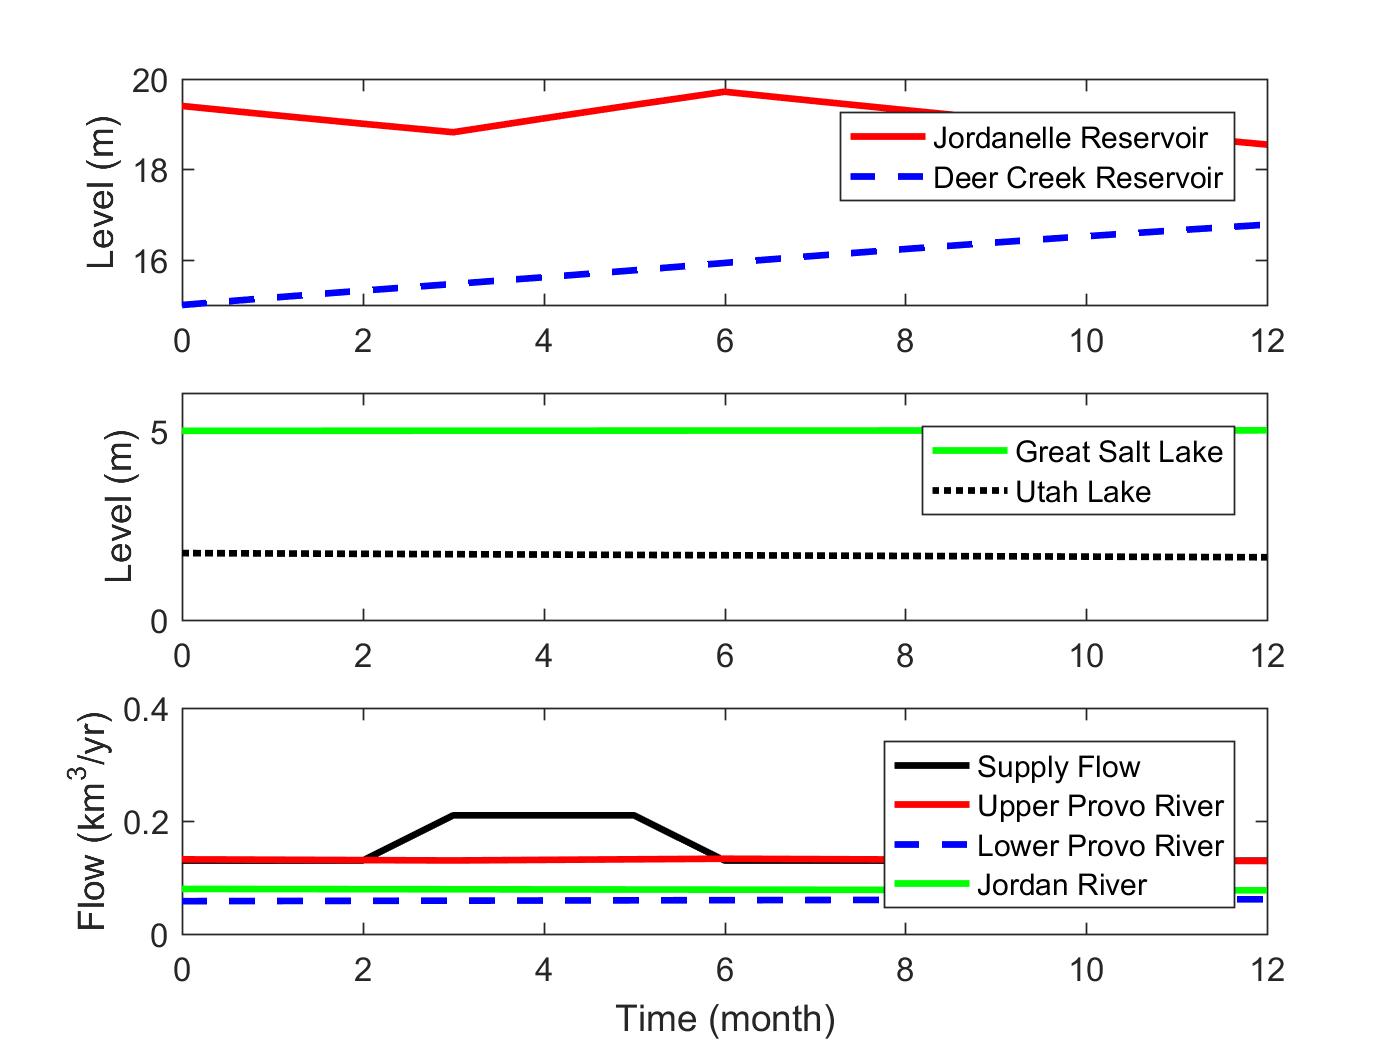
  • 建模要求:建立一个基于水量平衡方程的各高程高程变化情况,Develop a simplified dynamic model of the height change in each reservoir from water mass balances.Simulate the height of the reservoirs (in meters) over the course of a year, starting in January, with higher inlet flowrates in the spring due to melting snow. Use a mass balance to describe the change in volume and height of each body of water.

  • 给定相关初始条件及数据资料。Below are constants such as area (km^2) and usage requirements (km^3/yr), inlet and outlet flow correlations (km^3/yr), evaporation correlations, and initial conditions for the volumes (km^3).
    1
    2
    3
    4
    5
    6
    7
    8
    9
    10
    11
    12
    13
    14
    15
    16
    17
    18
    19
    20
    21
    22
    23
    24
    25
    26
    27
    28
    29
    30
    31
    32
    33
    **Outflow River Rates (km^3/yr)//径流量**
    Vflow_out1 = 0.030 sqrt(h1)
    Vflow_out2 = 0.015 sqrt(h2)
    Vflow_out3 = 0.060 sqrt(h3)
    Vflow_out4 = 0
    **Evaporation Rates (km^3/yr)//蒸发量**
    Vevap = 0.5e-5 * Area, for salt water (Great Salt Lake)
    Vevap = 1e-5 * Area, for fresh water (all others)
    **Inflow Rates (km^3/yr)//流入量**
    Vflow_in1 = 0.13 (July-Mar), 0.21 (Apr-June)
    Vflow_in2 = Vflow_out1
    Vflow_in3 = Vflow_out2
    Vflow_in4 = Vflow_out3
    **Usage Requirements (km^3/yr)//使用量**
    Vuse1 = 0.03
    Vuse2 = 0.05
    Vuse3 = 0.02
    Vuse4 = 0.00
    **Area of Reservoir / Lake (km^2)//水库及湖泊面积**
    A1 = 13.4
    A2 = 12.0
    A3 = 384.5
    A4 = 4400
    **Initial Volume of Reservoir / Lake (km^3)//初始容量**
    V1 = 0.26
    V2 = 0.18
    V3 = 0.68
    V4 = 22.0

对问题数据及变量进行了提取和梳理,构造.apm文件

1
2
3
4
5
6
7
8
9
10
11
12
13
14
15
16
17
18
19
20
21
22
23
24
25
26
27
28
29
30
31
32
33
34
35
36
37
38
39
40
41
42
43
44
45
46
47
48
49
50
51
**Constants**
! outflow constants(overflow river rates(km^3/yr)
c[1]=0.03
c[2]=c[1]/2
c[3]=c[1]*2
c[4]=0
! usage amounts(km^3/yr)
Vuse[1]=0.03
Vuse[2]=0.05
Vuse[2]=0.02
Vuse[4]=0.00
**Parameters**
! evaporation constants
evap_c[1:3]=1e-5 !fresh water
evap_c[4]=0.5e-5 !salt water
! surface areas
A[1]=13.4 !km^2
A[2]=12.0 !km^2
A[3]=384.5 !km^2
A[4]=4400 !km^2
! snow pack run-off
Vin[1] !see data file
**Variables**
! initial volumes (km^3)
V[1]=0.26
V[2]=0.18
V[3]=0.68
V[4]=22.0
! initial heights(m)
h[1:4]=1000*c[1:4]/A[1:4]
! outlet flow rates (km^3/yr)
Vout[1:4]=c[1:4]*sqrt(h[1:4])
**Intermediates**
! river flow rates (km^3/yr)
Vin[2:4]=Vout[1:3]
! evaporation rates (km^3/yr)
Vevap[1:4]=evap_c[1:4}*A[1:4]
**Equations**
$V[1:4]=Vin[1:4]-Vout[1:4]-Vevap[1:4]-Vuse[1:4]
1000*V[1:4]=h[1:4]*A[1:4]
Vout[1:4]^2=c[1:4]^2*h[1:4]

matlab 代码实现

1
2
3
4
5
6
7
8
9
10
11
12
13
14
15
16
17
18
19
20
21
22
23
24
25
26
27
28
29
30
31
32
33
34
35
36
37
38
%%require "apm package":relies on linear programming or nonlinear programming solvers to find a solution.
%% clear session
clear; close all; clc
%% simulate reservoirs
addpath('apm')
y = apm_solve('reservoirs',7);
z = y.x;
% convert time to months from years
time = round(z.time * 12);
%% plot results
figure(1)
subplot(3,1,1)
plot(time,z.h1,'r-','LineWidth',2)
hold on
plot(time,z.h2,'b--','LineWidth',2)
ylabel('Level (m)')
legend('Jordanelle Reservoir','Deer Creek Reservoir')
subplot(3,1,2)
plot(time,z.h4,'g-','LineWidth',2)
hold on
plot(time,z.h3,'k:','LineWidth',2)
ylabel('Level (m)')
legend('Great Salt Lake','Utah Lake')
subplot(3,1,3)
plot(time,z.vin1,'k-','LineWidth',2)
hold on
plot(time,z.vout1,'r-','LineWidth',2)
plot(time,z.vout2,'b--','LineWidth',2)
plot(time,z.vout3,'g-','LineWidth',2)
xlabel('Time (month)')
ylabel('Flow (km^3/yr)')
legend('Supply Flow','Upper Provo River','Lower Provo River','Jordan River')

实验结果如下图所示:

您的支持将鼓励我继续向前!